Weekend Market Commentary 10/2/15 – $RUT, $RVX, $SPX, $VIX, $VXV
Big Picture:
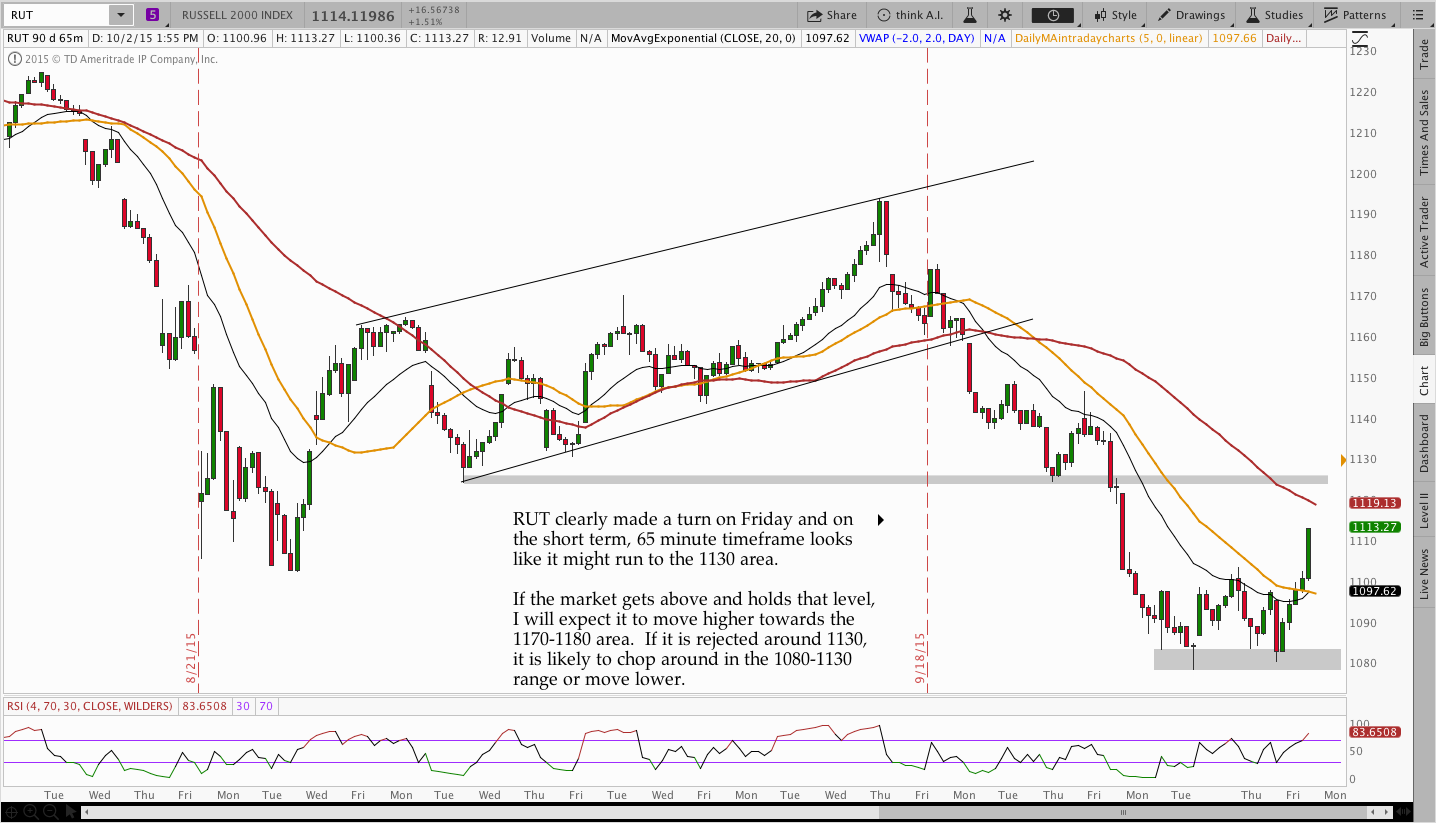
Late in the day Friday I sent out a Tweet with the image below.
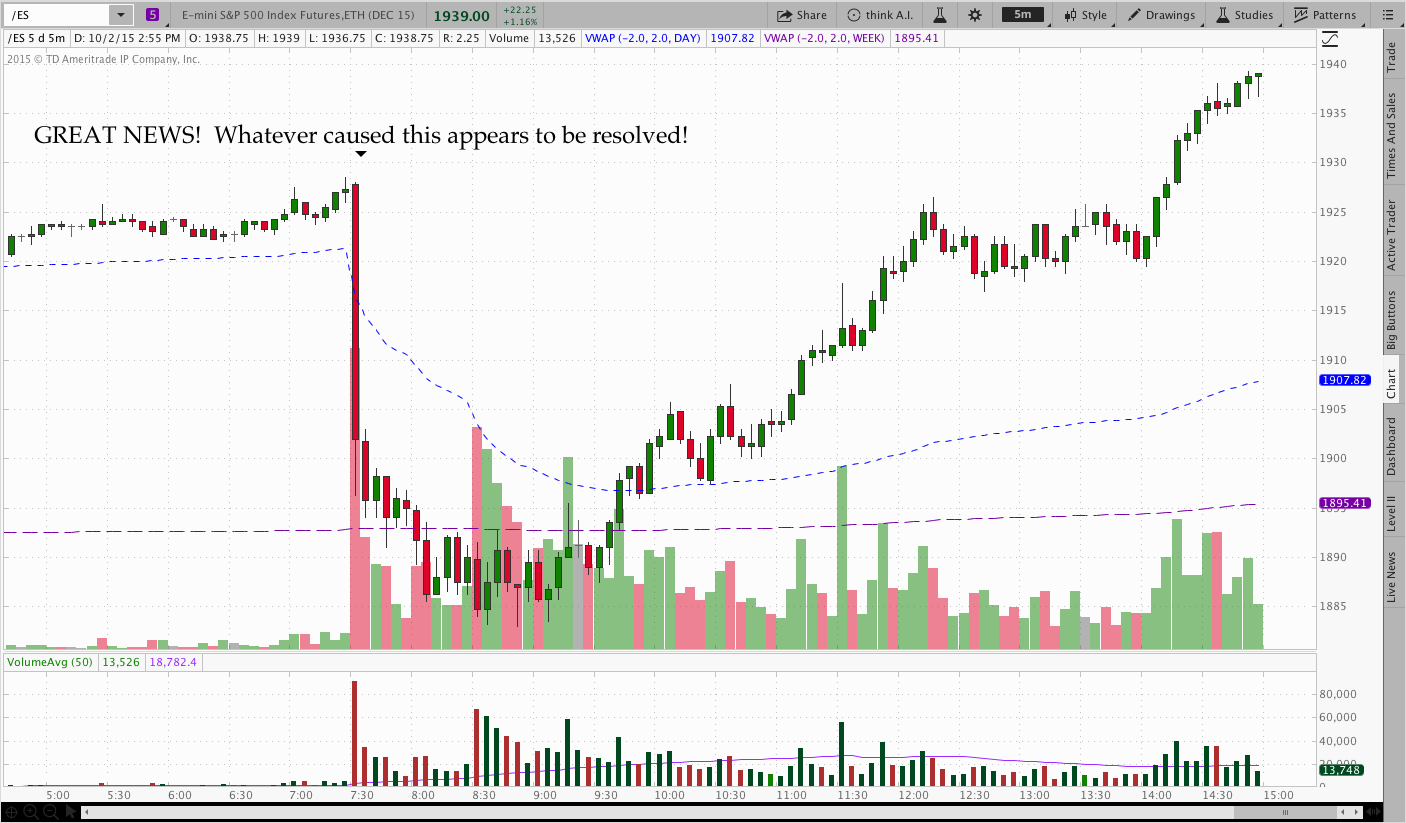
Sometimes the markets seem totally ridiculous on an intraday basis and the price action on Friday was a prime example. Apparently, an aggressive buyer (or buyers) decided to enter the market and drive it off the lows after a crash lower following bad data. That sort of activity makes skeptical traders (and I’m sure it’s more than just me) wonder if someone is manipulating the market. It’s both totally ridiculous and, at the same time, irrelevant from a trading standpoint because we can’t control it.
I spent a lot of time zoomed out on longer term charts this week looking for perspective. From a price standpoint, the correction we’ve had isn’t that significant. What we’ve seen in the past two months hardly qualifies as a true crash, but is that because it’s still playing out? We won’t know until after it happens or doesn’t happen. In the meantime, we might as well just focus on making positive expectancy decisions.
Right now the market is buzzing back and forth and a true trend hasn’t really emerged. We had a big break lower that’s been followed with a wide range consolidation. Until something changes, I expect that to persist.
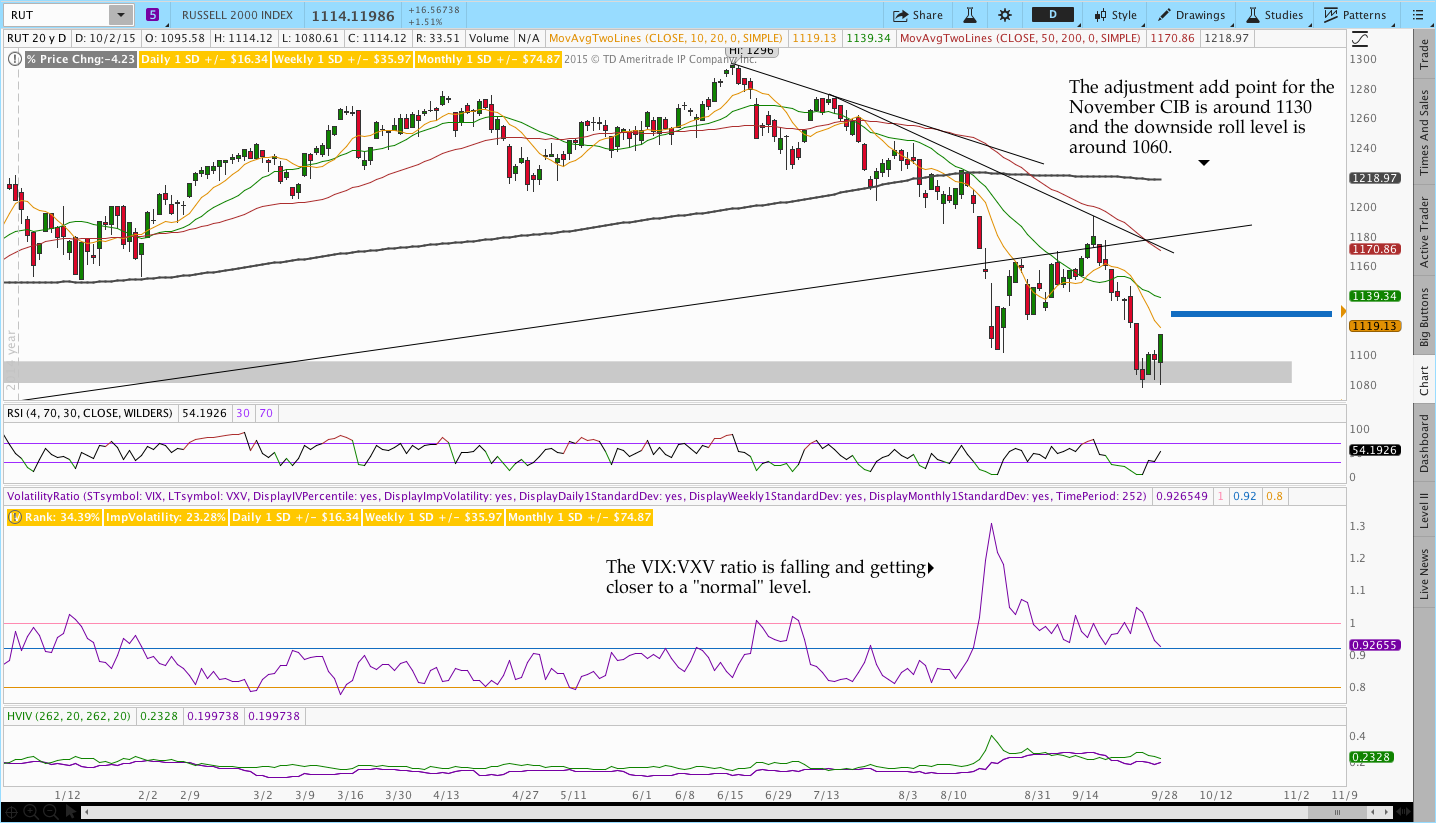
Volatility was not significantly bid higher this week even when the market moved lower. Additionally, the VIX:VXV ratio has failed to pop higher. Those clues suggests that either insurance has already been purchased or people are selling out of the money options on moves lower. As much as it pains me to say it, neither of those scenarios is particularly Bearish.
This was a somewhat active week for me from a trading standpoint. The big ranges we’ve seen have forced me to move around my position more than usual. In fact, I though I might end up rolling the Butterfly lower twice on back to back days. Fortunately, the market found some footing and that wasn’t necessary.
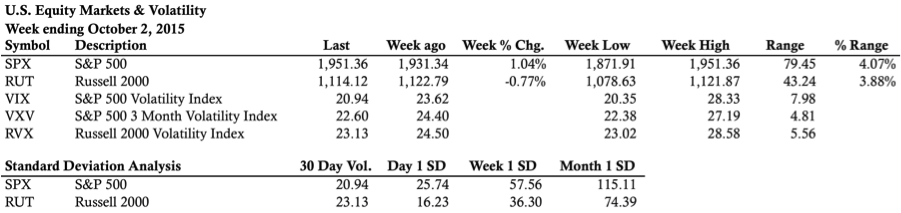
Market Stats:
Levels of Interest:
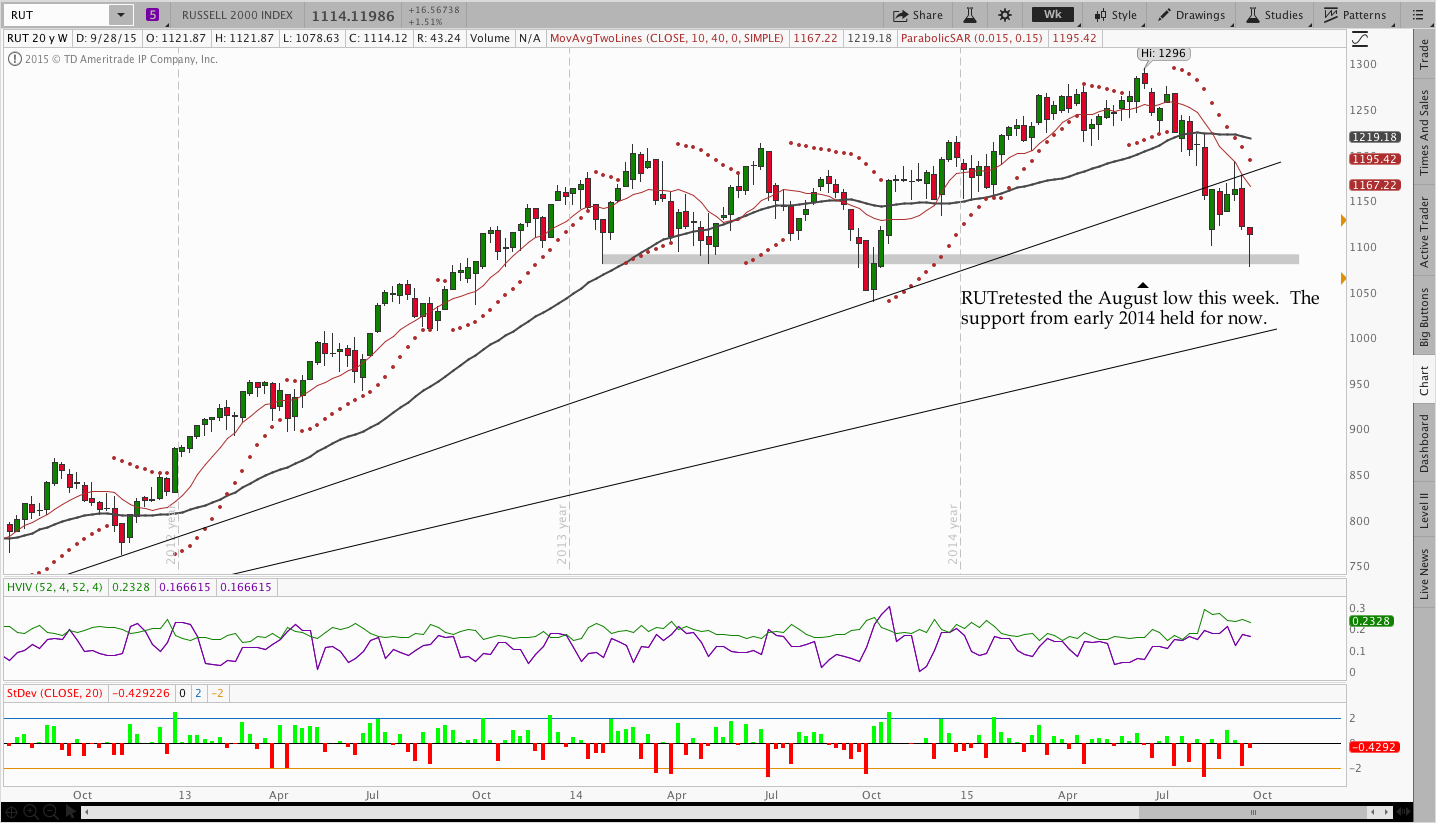
In the levels of interest section, we’re drilling down through some timeframes to see what’s happening in the markets. The analysis begins on a weekly chart, moves to a daily chart, and finishes with the intraday, 65 minute chart of the Russell 2000 ($RUT). Multiple timeframes from a high level create context for what’s happening in the market.
Live Trades . . .
The “Live Trades” section of the commentary focuses on actual trades that are in the Theta Trend account. The positions are provided for educational purposes only.
—————————–
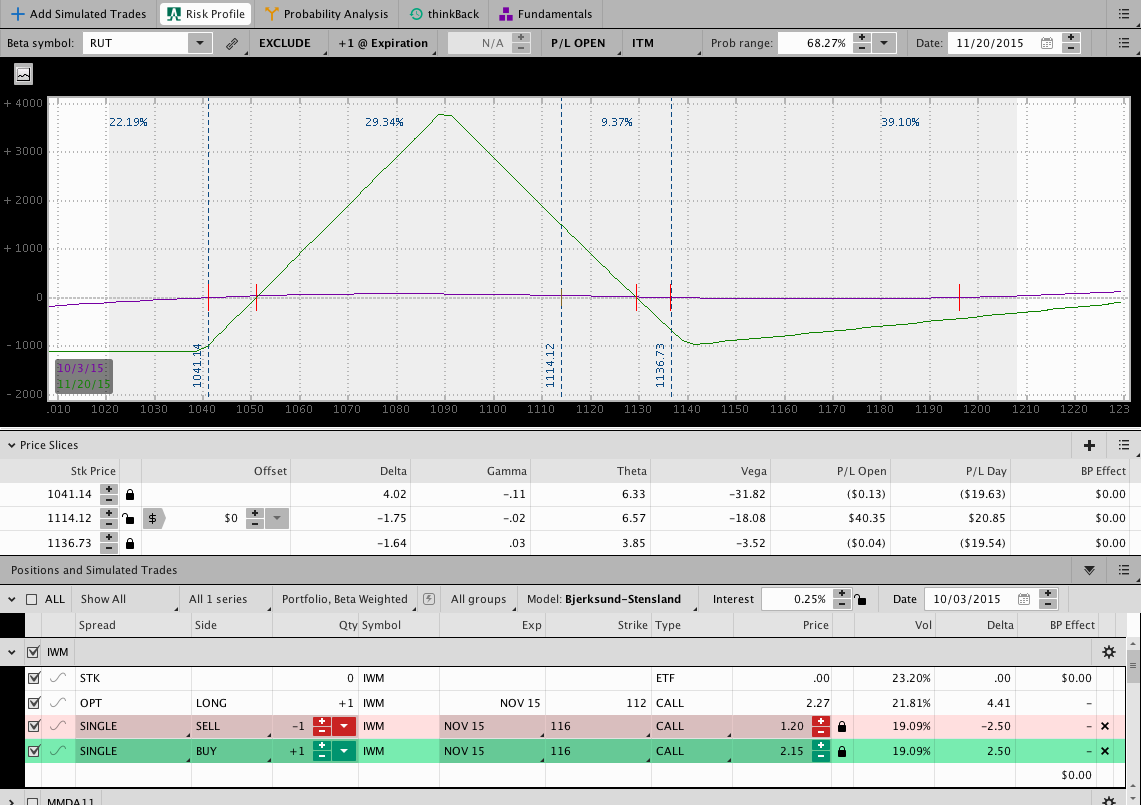
The November Butterfly is moving along and has a slight open profit. The trade began at 1130 and has been rolled lower twice. The trade is centered at 1090 after the rolls lower. The risk graph below includes one of the two adjustments. The second roll created a gain of $8 after commissions so I decided to leave it off the risk graph because it’s essentially irrelevant.
The CIB (now renamed to Core Income Butterfly) has evolved into my primary strategy this year. After the strategy made it through the crash lower and then higher last October, I realized that the dynamic nature of the trade had some promise and I began focusing on it considerably. This year, the October CIB successfully went through Black Monday and then the move higher despite some mistakes on my part. The trade has been very consistent with low directional risk (two of my favorite things).
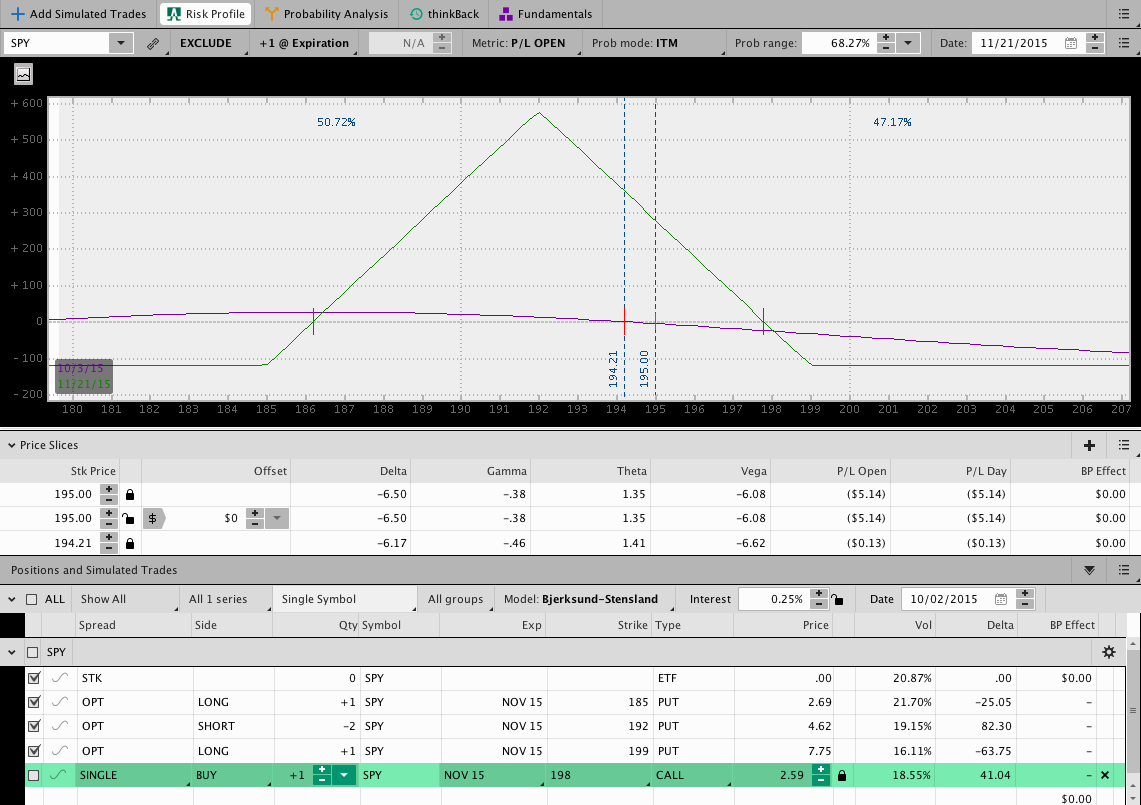
For those of you who found the discussion about the Migrating Butterfly strategy interesting, I thought I’d include an image of my November trade below. I’ve been trading the strategy in a very small IRA as a way of forward testing it. The small size makes commissions more challenging, but using a 7 point wide Butterfly in $SPY helps overcome that disadvantage somewhat.
In the Migrating Butterfly shown below, the adjustment add point is around 198.50.
Looking ahead, etc.:
As I mentioned above, I think we’re just in a big range right now. The Russell retested the lows this week and moved higher. If the market develops a patterns of higher highs and lows on the 65 minute timeframe, it has the potential to get above the 1130 level. Getting and holding above that level is likely to move price back towards the higher end of the consolidation. I guess I’ll come back and trade next week to see how things play out.
Thanks for reading and have a great weekend.
Please share this post if you enjoyed it.
Click here to follow me on Twitter.
Want to receive an alert as soon as the next market commentary is posted?

Sign up for my email list and stay up to date with the latest information on options trading.
Click here to sign up for the list, get a copy of the Theta Trend Options Trading System, the Trade Tacker I use, and information about new systems.
Even better . . . it’s all totally free.