How Should I Invest Part 4: The Game Plan
Today we’re going to take a look at a specific system for investing using ETF’s. The system below gives us an objective way to know where, how, when, and how much to invest. In this example, there are no fundamental insights (the news doesn’t matter) and the process is completely mechanical. Honestly, the investment process isn’t and shouldn’t be exciting.
Understanding Trends:
Markets, in many forms, have existed for thousands of years. Not surprisingly, people have been interested in markets and devoted a significant amount of time to researching and understanding markets. One of the observations that has held true over time is the concept that market prices trend. In other words, a market price will begin moving either up or down and that movement can continue for a significant period of time.
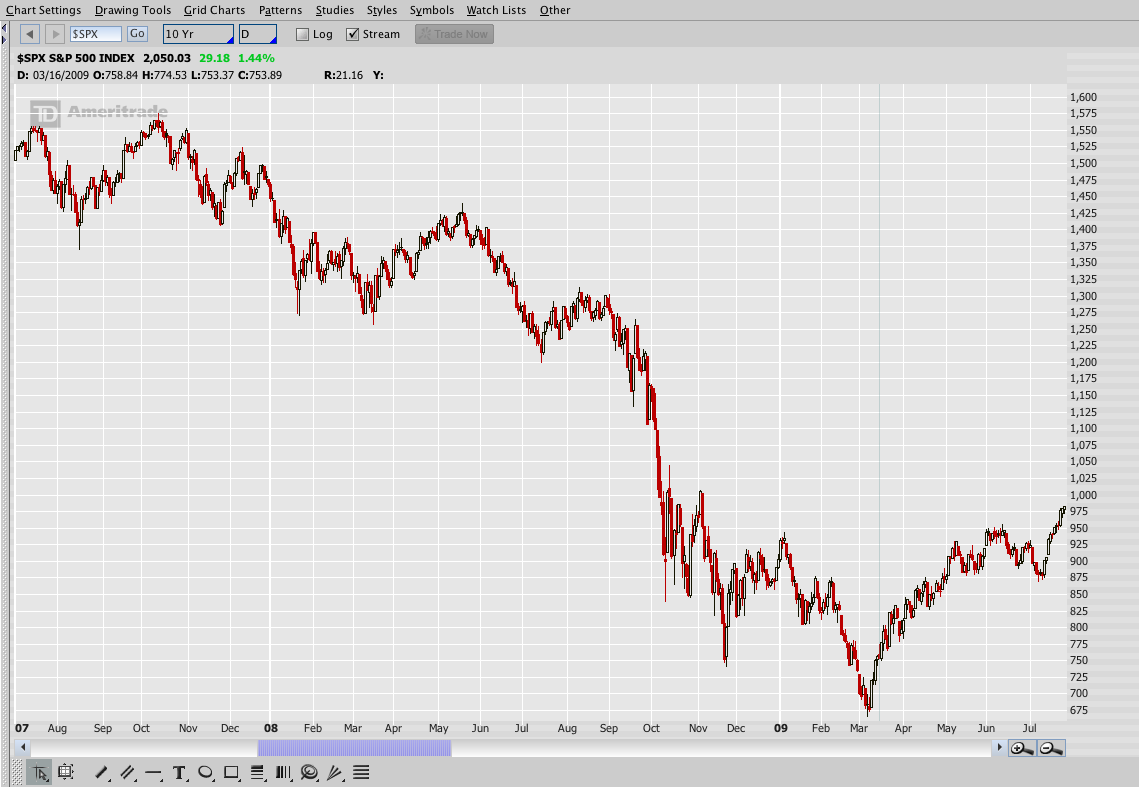
The price chart below shows the S&P 500 Index during the financial crisis of 2008. Every bar on the chart represents one day and most people would agree that the market was in a down trend during that period.
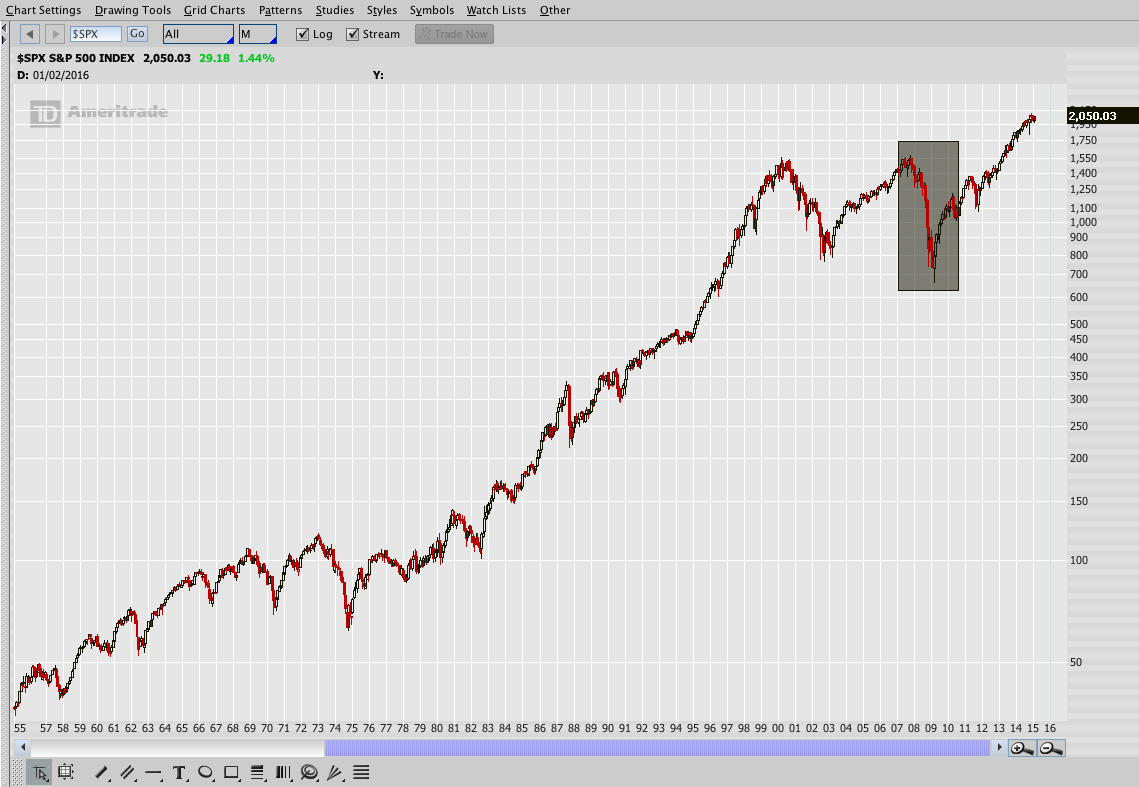
While the image above is fairly bleak, if we zoom out in time and take a look at the longer term trend in the S&P 500 we’re presented with a much different picture. The chart below is a log scale chart of the S&P 500 going back to 1955 with the financial crisis highlighted by the shaded rectangle. In this chart, every bar represents a month and the financial crisis seems much smaller.
The challenge:
As investors, we know that it’s beneficial to receive income on our investments, but we also want to own assets that are appreciating in price. As a result, we need a clearly defined system to help identify what assets are trending and when those trends have stopped. Trends can be confusing because they need to be defined by both price and time.
There are countless ways to define trend, but one of the easiest to understand is percentage change. Percentage change tells us the percentage return on an investment over some period of time. We can calculate the change in an investment over a day, week, month, year, or any other period. When we calculate percentage change over some period, we’re saying something about the trend for that period.
Many investors intuitively understand percentage change and attempt to invest in markets that are being discussed in the media because they have been exhibiting great returns. The media is always talking about stocks and markets that have made significant percentage moves. The problem with arbitrarily chasing returns mentioned by the media is that by the time the media has identified a trend, the trend is frequently coming to an end.
Calculating percentage change is simple and is done as follows:
Percentage Change = (Price Today – Price Yesterday) / Price Yesterday
In other words, we’re taking the change in price over some period and dividing that by the historical price. In the example above, we’re using the price yesterday, but we could certainly use another point in time such as the price a week ago.
It’s also common for people to interchangeably use the terms percentage change, rate of change, and momentum. Momentum is similar to percentage change in that it calculates the % change over some period; however, momentum also suggests that the rate of price change in a market has increased (or decreased) and will continue in that direction.
Momentum Investing is not a new concept. In fact, there are numerous academic papers and books written about the concept. As investors, all we care about is that historically Momentum Investing has worked.
Momentum Investing System Overview:
Note: Momentum Investing systems are covered extensively on the Theta Trend blog and there will be some links out to specific articles at the end of this post to expand on the discussion below.
In our sample Momentum Investing System we’re going to limit our investment universe to a basket of ETF’s. Despite limiting the universe, we’re going to have access to a wide range of markets including stocks, bonds, commodities, and foreign stocks. Access to a wide range of market should allow the system to perform more consistently regardless of what is happening in the stock market. History has shown that even though one market market might be going down, another is likely to be going up. The Momentum Investing system gives us a set of rules for finding the markets that are going up, investing in them, and knowing when to get out.
Every month we’re going to take our universe ETF’s and rank them by performance. Once we know the performance ranking, we’ll invest in the top 2 or 3 markets on the last trading day of the month. The difference between investing in the top 2 or 3 markets comes down to personal preference. In general, investing in the top 2 markets results in higher returns, but there is more equity volatility. In other words, your portfolio will take more heat or pain at times. Investing in the top 3 markets provides some additional diversification and less market pain, but that comes with slightly lower returns.
Momentum Investing System Rules:
- Identify a basket of markets to trade (see the list below). In this case, we want a broad range of markets that gives us access to theoretically uncorrelated asset classes.
- On a monthly basis, rank the markets based on the 3 month total returns. This is generally done a couple of days prior to the end of the month and updated the night before the last trading day.
- Allocate 50% of desired equity to each of the top two markets as long as the ETF’s are trading above their 6 month moving average. For example, if the second ranked market is below the 6 month moving average we don’t buy that market. If you want to trade the top 3 version of the system, you’d allocate 33% of your desired equity.
- If one of the top two (or three) positions is trading below the 6 month moving average, hold that portion of equity in cash or a Short Term Treasury ETF ($SHY, for example). The idea behind holding a Short Term Treasury ETF rather than cash is that the ETF will generate a small amount of interest with limited price risk.
- Ignore price fluctuations during the month and re-rank at the end of the month.
Here is a list of potential markets for the Momentum Investing System:
| Basic ETF Rotation System | Description | Market |
|---|---|---|
| AGG | iShares Core Total US Bond (4-5yr) | US Bonds |
| TLT | iShares Barclays Long-Term Treasury | US Bonds |
| BWX | SPDR Barcap Global Ex-U.S. Bond | International Bonds |
| PCY | Powershares Emerging Markets Bond (7-9 yr) | International Bonds |
| EEM | iShares MSCI Emerging Markets | Emerging Markets Equity |
| EFA | iShares MSCI EAFE | International Equity |
| VEU | Vanguard FTSE All-World ex-US | International Equity |
| DJP | Dow Jones-AIG Commodity Index | Commodities |
| GLD | SPDR Gold Shares | Commodities |
| IWM | iShares Russell 2000 Index Fund | US Small Cap Equities |
| SPY | SPDR S&P 500 Index | US Equities |
| VNQ | Vanguard MSCI U.S. REIT | US Real Estate |
Objections:
Sometimes new investors have objections to using a purely mechanical system to time the market, but the alternative is not having a well defined system. The reality is that your personality as an investor will determine how you choose to invest and that’s fine. What’s being presented here is a mechanical system that has worked historically. However, it is not the only solution for investing and there are numerous other solutions that work. The real point is that it’s essential to have a rule based plan for investing before you start buying and selling investments.
Resources:
Momentum Investing is discussed extensively on the Theta Trend Blog and I actively track and trade a few Momentum Systems. The following pages and posts provide additional information on Momentum Systems.
Market Momentum Newsletter – Monthly publication that covers Momentum Investing and tracks specific systems
Charles Schwab Commission Free ETF Rotation System Backtest
Backtesting A Basic ETF Rotation System In Excel – With Free Download
Moving on . . .
In the next post we’ll wrap up the How Should I Invest Series and talk about where to go for help with things don’t make sense.